March 11, 2026

A 2- year reflection.

Finance 4 Nurses Street Sign

A journey worth taking 

We are at the last weekend of the financial year. 

It’s been a fun one full of challenges and opportunities. 

I will give you a few insights into that in the next 1-2 weeks as we close off our books. 

I think you will find it interesting.  

In the meantime, the inspiration for today’s note came from an article during the week in the AFR “What investors can learn from 20 years of property data” AFR 20/6/25. 

Got to sound interesting. 

As a self-confessed numbers-nerd I wanted to take it further and see what insights we can get from the last 20 years. 

I compiled a spreadsheet of the data by City to answer the simple question. “Are there cities you should favour or avoid when deciding here to purchase. 

Read on… 

TLDR? Here’s a summary: 

  1. According to AFR, property has been a wonderful investment over the last 20 years, generating capital growth well above inflation. 
  1. My own analysis shows that although this is consistent on average across the capital cities, each city goes through cycles of growth spurts. 
  1. Despite this, there are signs of “reversion to the mean” i.e. cycles even out across cities and are not consistently maintained. 
  1. There is a standout lagging city right now, but you also need to consider the underlying basic that really makes Australian property: ongoing demand against a supply that simply cannot keep up.  
  1. What to do with this information? It is worth knowing, and at a minimum show, that you should not be concerned about where you buy in the cycle hindsight is easy, but importantly know they exist and there is no change in fundamentals that make residential property such a compelling proposition. 
  1. “What investors can learn from 20 years of property data” AFR 20/6/25. 

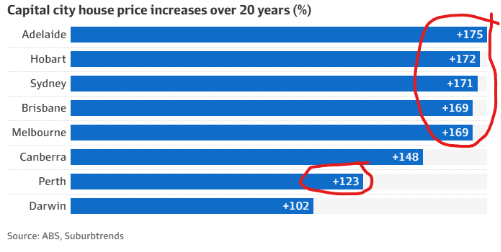
I won’t regurgitate the article – you can find it on-line, but for today’s purpose, two chart stands out to me – worth knowing in any times of doubt: 

  1. Although farmland has been the best end-to-end performer, residential property is a consistent performer years in. year out: 
  1. Within the capital cities, over a 20-years snapshot, the return is remarkably consistent across the cities.  

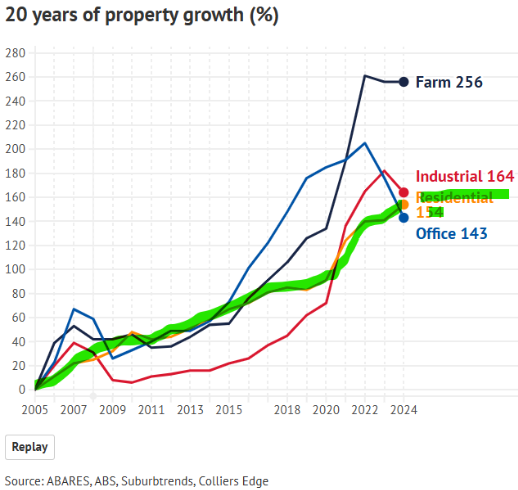
Those watching the market only after the last five years, may be surprised to see Perth is a laggard! 

  1. Following each city journey 

We are no “Rip Van Winkle” here.  

We don’t just buy and wake up in 20 years’ time to see that great news, my property has risen by 3x it doesn’t matter that I bought in Brisbane, Melbourne or wherever. 

Each city goes through its ups and a few downs.  

Unfortunately, you must cop these sometimes knowing that old Father Time will take care of you if you buy at the “wrong time”. 

This chart is one I put together and I know it looks like some vascular map gone wrong, we can get information from it, especially by following a cities “journey” over the 20 years. 

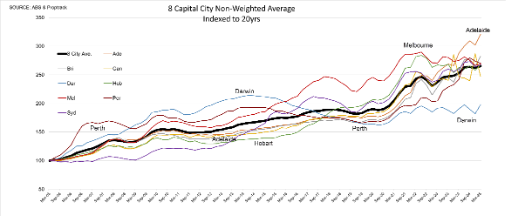
I could write pages on this but instead have marked some data points of some interesting cases. 

I think it is helpful to put yourself in each of these periods and imagine you had just purchased. What would you do? (hint: hang in!). 

  1. Perth started the period very strong as the mining boom was in full seeing, and then lagged the market for approx. 15 years, including a long period of stagnant/declining prices. It has only regained some of this lost ground I the last few years. 
  1. Adelaide consistently lagged the overall average for most of the 20 years. Although not as erratic as Perth, it has only recovered since COVID to now be the top performing city! 
  1. If we were doing this exercise 10 years ago, Darwin, would be king. It has been declining to be the laggard ever since. 
  1. Similarly. If we were doing this exercise 5-8 years ago, Melbourne would be the top performer. It has lost this lustre and reverted to the mean over the last five years. 
  1. What now? 
    Is Darwin a creaming buy? Maybe. 

Before you get excited to jump on the pane to warmer climes with pre-approval in hand, there is at least one important fundamental to remember.  

Supply and demand are still king.  

This chart from the ABS shows Darwin only grew by 1400 people in the last reported period.  

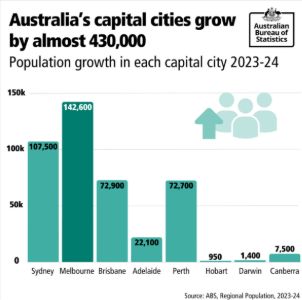
That’s not a lot of fresh demand…. 

We always start our process with a quick, complimentary consultation.

Finance4Nurses, under Tim’s leadership, serves nurses nationwide, his focus remains steadfast on empowering nurses with financial solutions that recognise their unique contributions and challenges.
© Copyright 2024. Finance4Nurses. All Rights Reserved.